Five ways our plan analytics can help you take action
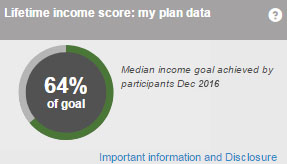
Lifetime Income ScoreSM
The Lifetime Income Score gives you a single barometer of your employees’ median income replacement.
Lifetime Income Data Visualization
Data visualization pinpoints employees’ progress toward income replacement, and can help you identify the employees who need help.

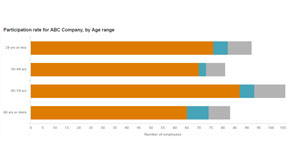
Demographic Breakdowns
See participation and deferrals by age, tenure and more – with easy data exports.
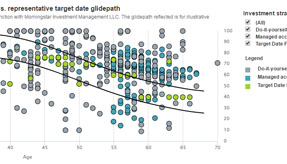
Investment Review
Conducting an investment review? You can see how participants are putting your lineup to work by viewing their individual allocations along an age-based glidepath.
Easy data exporting
Interested in seeing a detailed list? You’ll see exporting tools that can help you manage the data and take next steps.

IMPORTANT: The projections, or other information generated by the Lifetime Income ScoreSM regarding the likelihood of various investment outcomes, are hypothetical in nature. They do not reflect actual investment results and are not guarantees of future results. The results may vary with each use and over time.
AM130921-0617